Alerts when Lockdown blocks something
In Lockdown a blocked program fails silently unless you set alerts. Email, syslog, and webhook for denied execution, files, and network.
Overview: In Lockdown, Root Lock by HeartSuite blocks any execution, file access, or network connection not on the allowlist — whether or not anyone is connected to the Dashboard. Without alerts, a blocked program fails silently.
Alerts notify you of these blocks and of state changes the moment they happen. On a stable host with a complete allowlist, alerts are rare — most weeks you receive none at all. An alert means something unexpected happened.
For fleet and enterprise scale
Single-host setup is on this page (Dashboard → Alerts). For production fleets and compliance programs, use the dedicated guides:
- SIEM and Fleet Integration — Syslog, webhook, and status JSON for Splunk, Elastic, PagerDuty, and similar tools. The recommended path when you manage many servers without per-host TUI toil.
- Central Policy Management and External Control — Drive allowlist policy from Ansible, Terraform, ServiceNow, GitOps, and custom automation; consume syslog, JSONL approval logs, status.json, and webhooks for central visibility.
When alerts fire
Alerts are a push channel for blocks and state changes that warrant immediate attention; you still review and act on them from the Dashboard.
By default, Setup Mode logs without sending alerts, because alerting on expected Setup Mode activity would be constant noise. Alerts start when you activate Lockdown. On the Fleet tab, Setup Mode Alerts (Send security alerts while in Setup Mode) sends the same block alerts during Setup Mode — turn it on only when you want that extra volume.
Configuring alerts
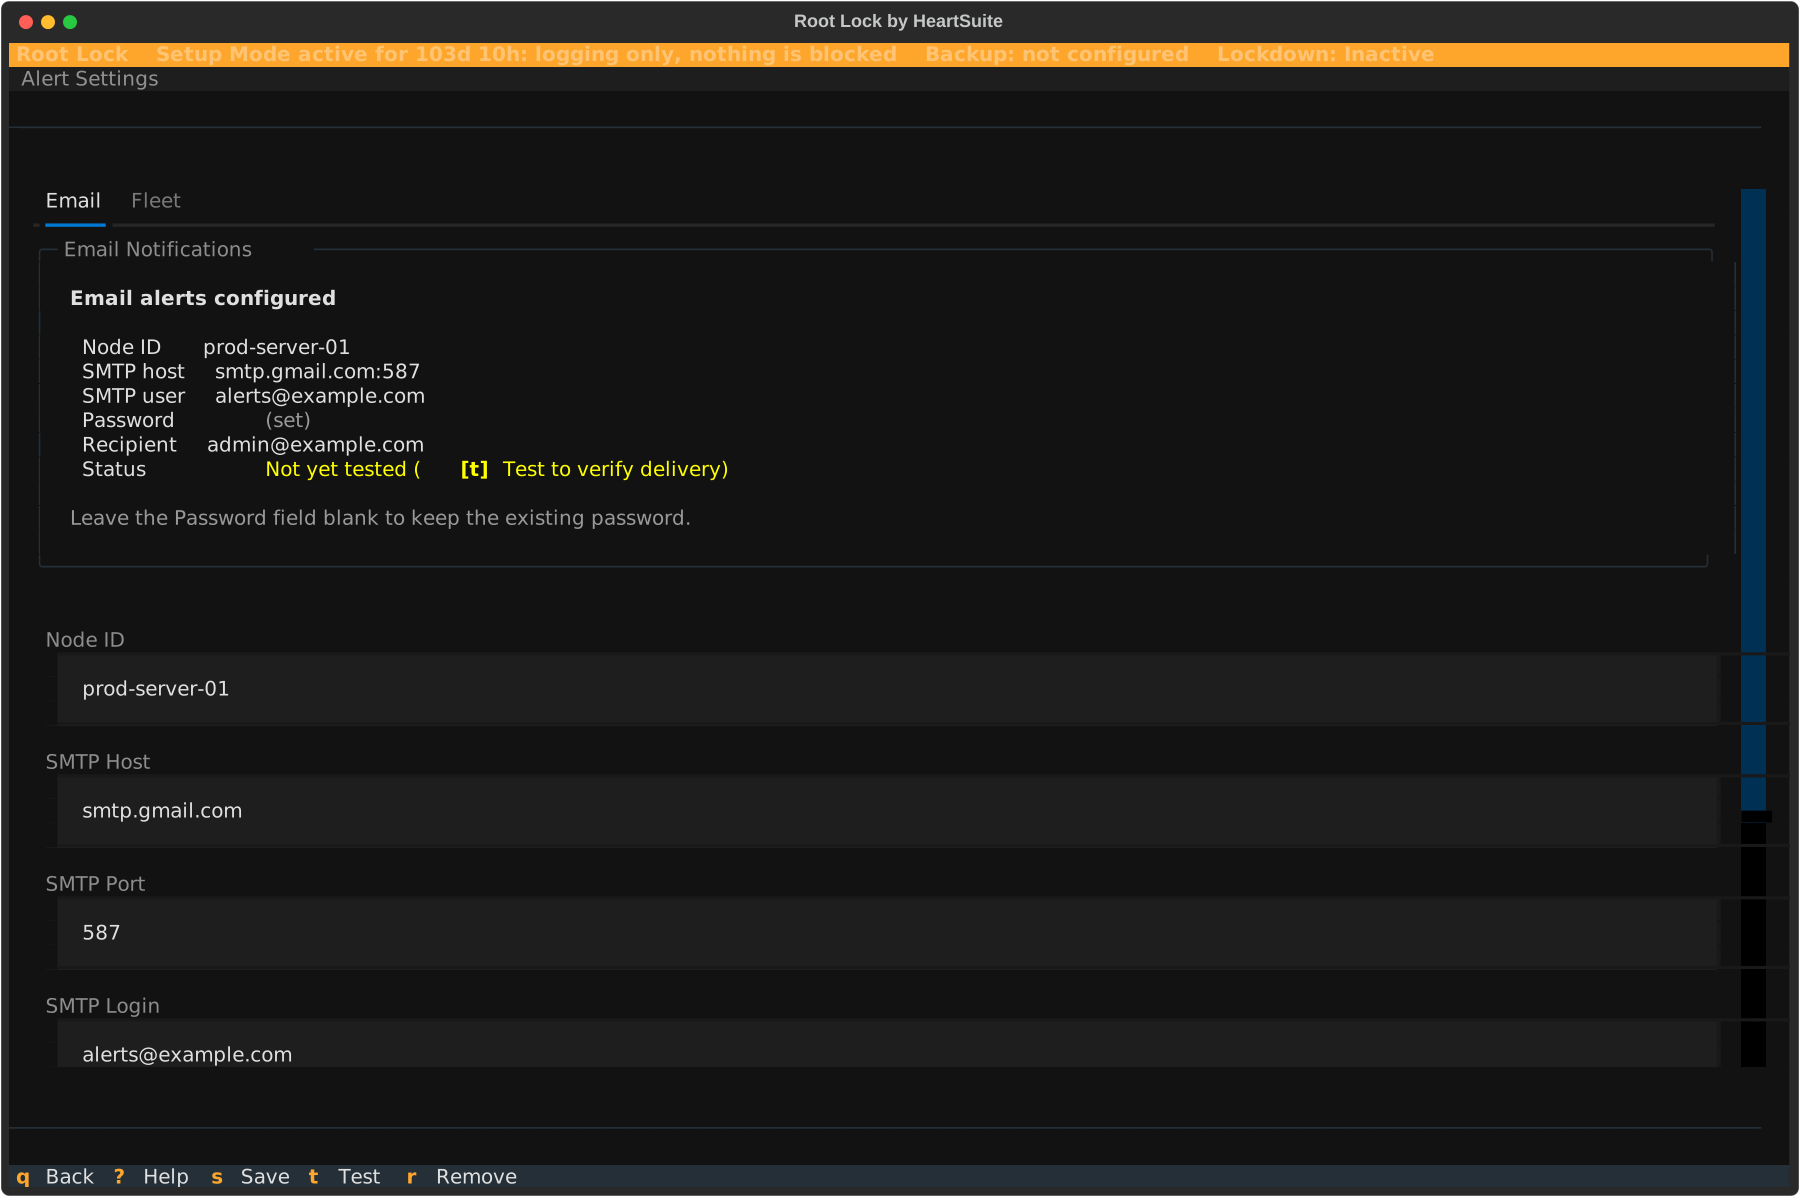
From the Dashboard, select Alerts ([e]). That opens Alert Settings, which has two tabs: Email and Fleet.
Email tab
Configure SMTP credentials to receive email alerts directly. Fields, in the order they appear:
- Node ID — defaults to the system hostname; set a recognisable identifier (for example
prod-web-03) so email subjects identify the source host. The JSON and syslog field is node_id. - SMTP Host
- SMTP Port (default 587)
- SMTP Login
- Password (masked on entry; never displayed after saving)
- Your email — the recipient address
Save ([s]) requires SMTP Host and Your email. Root Lock validates those fields without connecting to the server, so Test ([t]) is the only moment SMTP connectivity is verified: it sends a test email. If the test fails, the Result panel states what went wrong and what to try next, without the raw SMTP banners or authentication codes.
Once configured, the Email Status panel lists the stored values with the password shown as (set). The form stays visible — there is no Edit step. Leave Password blank to keep the stored password. Remove ([r]) deletes the stored SMTP credentials and turns email alerts off; syslog and webhook keep working.
Fleet tab
Configure syslog and webhook delivery for fleet and SIEM integrations. Channels are independent — enable any combination.
Setup Mode Alerts — A switch labelled Send security alerts while in Setup Mode. Off by default. When on, previously unseen programs, network bursts, and protected-file modifications alert in Setup Mode as well as Lockdown.
Syslog — A switch labelled Send alerts to /dev/log (LOG_AUTH facility). When enabled, Root Lock writes alerts to the local journal with identifier heartsuite, facility LOG_AUTH, and severity warning. The message text begins with heartsuite-alert:. No syslog server field is on this tab — you forward from the host with rsyslog or a shipper. After you save with syslog on, the Result panel shows an rsyslog forwarding rule example.
Verify syslog delivery with:
journalctl -t heartsuite --since "1 minute ago"
To forward to a SIEM, add an rsyslog output rule in /etc/rsyslog.d/heartsuite.conf:
:programname, isequal, "heartsuite" @@your-siem-host:514
See the rsyslog omfwd forwarding module documentation for forwarding syntax, and your SIEM’s own documentation for the receiving end:
Test Syslog ([t]) writes a test event to the journal.
Webhook — Field label Webhook URL (must be HTTPS). Root Lock POSTs a JSON payload to this URL on every alert. HTTP (non-TLS) URLs are rejected. When the URL contains pagerduty.com, PagerDuty routing key (Events API v2 integration key) appears. When the URL contains opsgenie.com, OpsGenie API key (Authorization: GenieKey …) appears. Other HTTPS URLs receive the generic payload below. Test Webhook ([w]) sends a test POST.
Example generic payload (a Lockdown block):
{
  "node_id":            "prod-web-03",
  "event_type":         "new_program_blocked",
  "timestamp":          "2026-03-31T14:22:00Z",
  "mode":               "Secure Mode",
  "lockdown":           true,
  "tier":               2,
  "paths":              ["/tmp/dropper", "/tmp/payload"],
  "count":              2,
  "message":            "2 previously unseen programs blocked.",
  "subscription":       "Active",
  "total_pending":      2,
  "pending_programs":   2,
  "pending_file_r":     0,
  "pending_file_w":     0,
  "pending_network":    0,
  "enrich_failed":      false
}
tier is 1 when you switch Setup Mode or Lockdown, and for allowlist, backup-coverage, and kernel-module config changes. It is 2 for denied programs, files, and network. mode is the on-disk token ("Setup Mode" or "Secure Mode"). The Dashboard label for "Secure Mode" is Lockdown. lockdown is the separate seal boolean.
To receive this payload, create an integration in your incident management tool and paste the endpoint URL into Webhook URL (must be HTTPS):
Status JSON — A passive monitoring surface at ~/.cache/heartsuite/status.json, updated every 60 seconds. Ansible, Nagios, and Zabbix can read this file via SSH pull. It is written whenever the alert daemon is running, so no Fleet setting turns it on or off. Your monitoring tool pulls the file; it pushes nothing.
At fleet scale, enable syslog on every node, forward via rsyslog to your SIEM, and alert from the SIEM’s own rule engine. Webhook covers incident management tools (PagerDuty, OpsGenie). Status JSON covers Ansible health checks. Email is for a single host or as a supplementary channel.
For production examples (Filebeat/Elastic, rsyslog forwarding, webhook targets, verification commands) and the scale path for larger teams, see SIEM and Fleet Integration. That page also covers policy and posture data for allowlist tables and drift views in Kibana/Elastic — that export is not a Fleet-tab switch.
To own and apply allowlist policy from Ansible, Terraform, GitOps, ServiceNow, or custom scripts — including pre-seeding, harvesting a baseline from a reference host, and consuming status.json / JSONL approval logs / syslog / webhook — see Central Policy Management and External Control. The Dashboard is the surface for a single host.
What triggers an alert
Switching Setup Mode and Lockdown
These fire immediately when you switch between Setup Mode and Lockdown — no 5-minute window, no digest. The same immediate path covers allowlist changes while Lockdown is active, backup coverage loss, and kernel-module config changes:
| Alert | When it fires |
|---|
| Mode switch | You leave Setup Mode for Lockdown, or leave Lockdown for Setup Mode |
| Lockdown activated or deactivated | Immediately when the seal goes on or off |
| Allowlist modified while Lockdown is active | On detection |
| Backup coverage disabled or reduced | When protected backup directories disappear |
| Kernel-module config modified | When a kmod load/blacklist file under the watched paths changes |
Blocks in Lockdown
These blocks apply a threshold filter. They fire in Lockdown, and also in Setup Mode when Setup Mode Alerts is on:
| Block | Trigger condition |
|---|
| Previously unseen program blocked | A program path appears that has never appeared in any prior log session |
| Network burst to new destinations | A program generates denied connections to previously unseen destinations within a 2-hour window |
| Protected file modified | A new backup version is created for a file under /etc/, /bin/, /usr/bin/, /sbin/, /lib/, or /usr/lib/ |
Not alerted:
- Setup Mode activity while Setup Mode Alerts is off
- Repeated blocks of the same program–destination pair already seen in the current session
- File version activity under
/tmp/, /var/tmp/, or /dev/shm/ - Dashboard sessions opened or closed
- Successful allowlist approvals
Email, syslog, and webhook timing
Email — 5-minute accumulation window
Blocks are grouped before delivery. A dropper that installs 40 payloads in 90 seconds produces one email — subject Root Lock — 40 unknown programs blocked — prod-web-03 — not 40 individual messages. Volume and velocity are the attack signal; 40 separate emails fragment that signal into noise.
- The 5-minute window starts on the first block of a given type
- Additional blocks of the same type within that window are added to the pending bundle
- At window close, one email is dispatched covering all accumulated blocks
- Blocks of different types accumulate independently — a network burst does not delay a file modification alert
Digest mode: After 3 block emails in a single hour, further blocks are queued and delivered as one digest email at the hour’s end. Switching Setup Mode or Lockdown is never held — those emails go out immediately, as do the other events in the table above.
The 5-minute window and hourly cap apply to email only. They are fixed, not user-configurable.
Syslog and webhook emit every alert immediately, without grouping or windowing. SIEM platforms (Splunk, Elastic) and incident management tools (PagerDuty, OpsGenie) apply their own correlation and deduplication — grouping alerts before they reach these systems removes information they need.
If a configured channel is silent in Setup Mode, check Setup Mode Alerts. Off (the default) means that silence is expected, not a misconfiguration.
With at least one push channel configured, the Dashboard unlocks Lockdown. Follow the Suggested Next Step to activate Lockdown.
1 - Pipe Lockdown blocks into the SIEM you already run
Syslog and webhook into SIEM, EDR, and incident tools. The fleet path when you do not want a Dashboard session on every host.
Overview: Root Lock by HeartSuite integrates with your existing SIEM, EDR, and observability stack via syslog (journald/rsyslog) and webhook. Configure once in Alert Settings → Fleet, and let your central tooling handle monitoring, correlation, and alerting. There is no requirement to run the Dashboard on every host for day-to-day fleet visibility.
Root Lock emits kernel denial decisions and higher-level alerts in real time. Allowlisted work that succeeds is not streamed, so every event your SIEM receives is either a denial or an alert.
Syslog (recommended for SIEM ingestion)
When the Fleet tab Syslog switch is on (Send alerts to /dev/log (LOG_AUTH facility)), every alert and every kernel denial is written to the local journal under identifier heartsuite. Alert message text begins with heartsuite-alert:.
Filebeat / Elastic (or any rsyslog-compatible shipper)
# filebeat-heartsuite.yml (adapt to your existing stack)
filebeat.inputs:
  - type: journald
    id: heartsuite-enforcement
    include_matches:
      - "SYSLOG_IDENTIFIER=heartsuite"
output.elasticsearch:
  hosts: ["https://your-elastic:9200"]
  # username, password, ssl.* etc. from your existing config
logging.level: warning
The journal identifier is heartsuite on every host. How you ship that identifier is stack-specific: Filebeat journald for Elastic, a universal forwarder or HEC for Splunk, a DSM for QRadar, promtail for Loki. The YAML above is an Elastic example, not a universal ingest path.
Pre-flight check on the host:
filebeat test config && filebeat test output
Direct rsyslog forwarding
Create /etc/rsyslog.d/heartsuite.conf:
:programname, isequal, "heartsuite" @@your-siem-host:514
# Use @ for UDP or the TLS modules for production
Then:
sudo systemctl restart rsyslog
journalctl -t heartsuite --since "1 minute ago"
Enter an HTTPS URL in Webhook URL (must be HTTPS) on the Fleet tab. Root Lock posts a JSON payload on every alert (immediate delivery, no batching — let your receiver deduplicate). HTTP (non-TLS) URLs are rejected. When the URL contains pagerduty.com or opsgenie.com, the matching key field appears and Root Lock posts that vendor’s native format instead of the generic payload.
Example generic payload (a Lockdown block):
{
  "node_id":            "prod-web-03",
  "event_type":         "new_program_blocked",
  "timestamp":          "2026-03-31T14:22:00Z",
  "mode":               "Secure Mode",
  "lockdown":           true,
  "tier":               2,
  "paths":              ["/tmp/dropper", "/tmp/payload"],
  "count":              2,
  "message":            "2 previously unseen programs blocked.",
  "subscription":       "Active",
  "total_pending":      2,
  "pending_programs":   2,
  "pending_file_r":     0,
  "pending_file_w":     0,
  "pending_network":    0,
  "enrich_failed":      false
}
mode is the on-disk token ("Setup Mode" or "Secure Mode"). The Dashboard label for "Secure Mode" is Lockdown. lockdown is the seal boolean. tier is 1 when you switch between Setup Mode and Lockdown, and for allowlist, backup-coverage, and kernel-module config changes. It is 2 for denied programs, files, and network.
Supported targets:
- PagerDuty Events API v2 (routing key field appears for
pagerduty.com URLs) - OpsGenie Incoming Webhook (API key field appears for
opsgenie.com URLs) - Slack Incoming Webhooks
- Generic HTTPS JSON receivers
Test Webhook ([w]) sends a test POST, so you can confirm the receiver accepts the payload before a real alert depends on it.
Status JSON (pull-based monitoring)
A passive, always-on snapshot is written every 60 seconds to ~/.cache/heartsuite/status.json. No Fleet setting turns this on or off.
Fields of particular interest for health checks:
mode, is_hs_kernel, lockdown, daemon_ok, node_idpending_* counts (non-zero in Lockdown usually indicates something needs investigation)channel_errors (email, syslog, webhook), each with message and at
Tools that can consume it directly:
- Ansible facts / custom modules over SSH
- Nagios / Icinga / Zabbix (SSH or file checks)
- Any script that
cats or jqs the file on a schedule
Policy and posture data in Elastic and Kibana
In addition to the enforcement and alert streams, Root Lock can emit structured policy and posture data — snapshots of the current allowlist and periodic reports of the host’s protection posture. When ingested into Elasticsearch, that data supports views of the allowlist across your fleet.
Use it for:
- Tables of approved programs with their exact file and network grants
- Counts of programs, broad-write risks while locked down, and reporting hosts
- Drift detection by comparing each host with the allowlist you keep in Git
- Filtering for higher-risk entries using
risk_level, has_broad_write, has_network_grant, and lockdown_active_at_capture
Use the Dashboard on individual hosts to review the queues, change the allowlist, and activate Lockdown. Use the central view for scanning, filtering, and correlating posture at fleet scale.
Production path on real hosts
On production hosts, ship enforcement and alert streams via syslog or Filebeat as described above. Ingest into your existing Elasticsearch cluster and build Kibana dashboards with your standard security, retention, and access controls. Alert Settings has no policy-or-posture export switch — Fleet configures syslog and webhook only. No separate HeartSuite download is required for this path.
For lab, evaluation, and customer demos, HeartSuite offers tools/kibana-bridge/: an optional disposable Docker stack (Elasticsearch, Kibana, and a small ingest receiver) that turns Root Lock telemetry (apo_change, heartbeats, enforcement) into policy-centric Kibana views.
heartsuite-install.sh does not install it. Request an evaluation kit from support@heartsecsuite.com or use the materials included with your coordinated release delivery.
The bridge is a read-only view that sits beside the syslog enforcement streams; production needs only those streams. Typical views include:
- A living allowlist table (one row per
program_path with grant counts, risk_level, has_broad_write, has_network_grant, and related fields). - KPI-style posture metrics (policy counts, broad-write risk while locked down, high-grant surface, recent blocks).
- Drift detection by comparing each host with the allowlist you keep in Git.
- Enforcement correlation for drill-down alongside policy rows.
The stack is localhost-only, security-disabled, and throwaway (docker compose down -v wipes volumes). Do not publish Kibana, Elasticsearch, or the ingest receiver on a public IP without a network perimeter — for example a cloud firewall allowlist of known lab addresses, or an SSH tunnel so the browser reaches only localhost.
Use the production path above for real access control, TLS, and retention.
Versus tools/siem-test/: These are sibling evaluation fixtures with different purposes (both available on request, not on production hosts):
| Fixture | Purpose |
|---|
tools/siem-test/ | Alert channel validation (syslog, email, webhook). Optional Kibana is for eyeballing raw text events. |
tools/kibana-bridge/ | Policy-surface visibility in Kibana (tables, KPIs, risk filters), using richer telemetry payloads. Drift is a comparison with the allowlist you keep in Git. |
They can run side by side on the same machine (different ports).
Quickstart (evaluation):
cd tools/kibana-bridge
docker compose up -d
docker compose run --rm setup
# Open http://localhost:5601 (or http://127.0.0.1:5601)
After setup, Kibana includes preconfigured data views:
- HeartSuite Policies — primary view for the living allowlist table (Lens tables); compare it with the allowlist you keep in Git to find drift.
- HeartSuite Events — raw telemetry and event drill-down in Discover.
An optional imported dashboard, HeartSuite - Policy Overview, may also be present when saved objects are bundled with your checkout.
To feed live data during lab work, forward syslog or the evaluation-kit telemetry to the bridge ingest receiver, or ingest exported policy data into your production Elasticsearch using the same field model. Setup detail is included in the evaluation kit README shipped with tools/kibana-bridge/.
Pairing with Ansible central policy
The exported policy data model pairs with Ansible (or Terraform/GitOps) central policy: curate one allowlist in your repo, push via the heartsecurity.root_lock Ansible role, /.hs/sys/batch_record_add.py, or /.hs/sys/hs-app-perm-orders-manager, and use Kibana tables and KPIs for fleet visibility. Compare the allowlist you keep in Git for drift. Git history is the policy change record. Policy identity is not on status.json, syslog, webhook, or Kibana.
The bridge (or your production Elasticsearch deployment) is the read side. Your control plane remains the write path.
See Central Policy Management and External Control for Ansible role variables, seed application, harvest patterns, and composition with full server deployment playbooks.
Verification commands (run on the HeartSuite host)
# Recent alerts and enforcement decisions (journal identifier is heartsuite)
journalctl -t heartsuite --since "10 minutes ago"

# Status snapshot (for pull monitors)
cat ~/.cache/heartsuite/status.json | jq .
Relationship to the Dashboard
All channels are configured from the Dashboard: Alerts ([e]) opens Alert Settings. The Fleet tab is the place for syslog, webhook, and Setup Mode Alerts. Status JSON is written whenever the alert daemon is running. Email remains available as a supplementary or low-volume channel.
At fleet scale: syslog for the SIEM, webhook for incident response platforms, and Status JSON for infrastructure-as-code health checks. The Dashboard remains the place for initial setup, exception review, and maintenance — not for ongoing fleet monitoring.
Policy management is the inbound complement: your central systems curate and apply allowlists via the shipped CLI tools, pre-seeding, and automation patterns. See Central Policy Management and External Control.
Once at least one push channel is configured, you can proceed to Lockdown.
For the UI configuration steps in detail, see the parent Alert Settings page.
2 - Drive the allowlist from your own tooling
Keep policy in Ansible, Terraform, ServiceNow, or custom automation. Export and apply Root Lock allowlists at fleet scale instead of one Dashboard session per host.
Overview: Root Lock by HeartSuite is designed to be driven by your existing central tooling. The Dashboard is the surface for a single host. At fleet scale, your control planes curate policy, apply it to each host, and collect what each host reports back.
Cloud Path and Local Path remain how each host is installed. This page covers the fleet work around that install: harvesting an allowlist baseline from one host, installing that seeded package on many hosts, and applying extras without a Dashboard session on every machine.
Each host enforces its own allowlist, and Lockdown seals that allowlist on the host. HeartSuite has no central server that pushes policy to many hosts — your automation applies it per host, and each host exports status, alerts, and an approval log for central visibility and attribution.
Keep policy curation, change approval, and fleet-wide visibility inside the tools you already run (Ansible, Terraform, GitOps repositories, ServiceNow, Splunk, Elastic, custom orchestration).
Policy curation in your central systems
A repository you already run — usually Git, applied by Ansible, Terraform, or similar — holds the list of approved programs, file-access paths, and network destinations. Your CMDB keeps describing hosts and apps, and your ITSM tickets keep approving changes; the repository is where the grants themselves live.
- Keep policy as text lists (one absolute program path per line) or structured data your automation can parse.
- Put changes through your normal processes: code review in Git, change tickets in ServiceNow, or a policy-as-code pipeline.
Two ways to seed the allowlist
Root Lock accepts seed policy at two points. An install-time baseline gives a new host the full allowlist of a host that already ran the same workload, so initial setup finishes quickly instead of running a multi-hour observation period on every node. A post-install program list adds programs to a host that is already running Root Lock.
| Install-time baseline pre-seed | Post-install program list |
|---|
| Purpose | Start initial setup from a known baseline harvested from a reference host | Add program approvals after Root Lock is up |
| When | Before or during install — the package or image carries the baseline | After Root Lock is installed and initial setup is complete |
| Shape | Installer baseline material, enabled with installer options such as --apo-seed | Plain text: one absolute program path per line (# comments allowed) |
| Apply with | The seeded installer or image; Ansible runs that installer | hs_seeds / hs_programs (Ansible role), batch_record_add.py, /.hs/sys/hs-app-perm-orders-manager |
A program list carries program paths; the installer baseline also carries each program’s grants and is what shortens initial setup. Re-applying a harvested baseline as a text list after initial setup therefore gains nothing. Program lists earn their place for role-scoped bootstrap lists (for example SSH and application entry points), for stack extras you approve after reviewing the queues, and for hosts that never ran those paths during setup.
Seed a fleet from one reference host
- Reference host. Run initial setup on one host of this class under its real, full workload, then review what remains in the queues. If this host was installed without a baseline, this is the one time the fleet pays the multi-hour observation period.
- Harvest the installer baseline from that host with the harvest and packaging tooling. Ansible can orchestrate the collection over SSH. The result is installer baseline material — programs and their grants — for step 4, not an
hs_seeds list. - Review the baseline and promote it into your package pipeline.
- Build or obtain a Root Lock install package with baseline pre-seed enabled (for example installer option
--apo-seed). Packages can ship with pre-seed off; enable it here. - Start each fleet node from a clean OS.
- Install Root Lock with Ansible, pointing the playbook’s install bundle at the pre-seeded installer. Initial setup starts from the baseline and finishes quickly.
- Deploy application and hardening automation, then review only the differences in the Dashboard.
- Optional: harvest extras with
get_allowlist_programs() from the limited_tools Python API, which prints one program path per line, and review the paths. Apply them with hs_seeds, which approves each program path, or with batch_record_add.py, which approves those paths and also grants read on /usr/lib and /etc. - Activate Lockdown once the subscription, alert, and queue checks pass.
The first reference host of a class has no baseline to start from: install it on a clean OS without pre-seed, let initial setup run under the real workload, review the queues, and harvest from step 2. Every later host follows the order above.
Seed only what the reference host’s real workload ran, and leave out paths from test runs or one-off commands. An item in the pending queue becomes a grant only when you approve it.
Applying policy from automation
Use the CLI tools shipped with every installation (documented in the Appendices and Batch Allowlisting Tools) to apply post-install policy from your control plane:
/.hs/sys/hs-app-perm-orders-manager — inspect current state, add or remove specific entries for programs, file paths, and network destinations. /.hs/sys is not on PATH, so call it by its full path.batch_record_add.py — bulk-seed programs from a plain-text list of paths (adds each with standard library and configuration directories).
Run these tools over SSH, via config-management agents, or as part of provisioning scripts after Root Lock is installed and initial setup is complete. Your central system prepares the seed data or change set; the automation layer delivers and applies it to each target host.
Subscription activation (hs-activate-subscription) is still required on each host before Lockdown can be engaged — this is the entitlement step and remains local.
Examples for the primary integration patterns follow.
1. Ansible — playbooks for seeding and applying policy
HeartSuite provides an official declarative Ansible role (heartsecurity.root_lock) for fleet policy application and Lockdown transitions. It is modelled on linux-system-roles.selinux and ships with coordinated release materials; email support@heartsecsuite.com if you need the role package.
On every installed host, the limited_tools Python API under /opt/heartsuite is the runtime integration surface the role uses. A shell-and-CLI alternative using batch_record_add.py and hs-app-perm-orders-manager follows below for ad-hoc or legacy playbooks.
Official Ansible role: heartsecurity.root_lock
Overview: The role provides variable-driven management of allowlist programs and mode transitions. Re-running a play does not create duplicate entries. It is modelled on linux-system-roles.selinux (and rhel-system-roles.selinux) so administrators familiar with RHEL declarative SELinux policy can apply the same playbook patterns.
The role assumes Root Lock is already installed. It focuses on allowlist management plus mode transitions (Setup Mode / Lockdown). Full server provisioning — base OS preparation, hardening (for example the dev-sec collection), SFTP receiver setup, bundle-based installation, and post-install configuration — belongs in thin orchestrator playbooks that compose heartsecurity.root_lock with upstream collections and host-specific tasks.
A reference provisioning example for a Debian 12 server is in the code repository under ansible/examples/hs-debian12-provision/. The pattern: install Root Lock and let initial setup run, start with a minimal role-scoped bootstrap allowlist from a seed file, and run the real workload. After you review the queues, keep the extra programs Setup Mode logged in a seed file and re-apply it with the role on the hosts that need those paths.
Requirements:
- Root Lock already installed on managed hosts.
- Initial setup finished before you apply workload
hs_seeds or stack playbooks that expect a reviewed baseline. become: true — all operations are privileged.- Ansible >= 2.9.
- The role invokes the production Python API in
/opt/heartsuite (limited_tools via /opt/heartsuite/venv/bin/python3 and /opt/heartsuite/src).
Key variables (all prefixed hs_ to avoid collision with SELinux role variables):
| Variable | Purpose |
|---|
hs_state | Mode transition: secure or lockdown (synonyms). setup is informational only (no-op). Unset leaves mode unchanged. Calls switch_to_secure() with the same precondition gates as the Dashboard. Leave it unset until the subscription, alert, and queue checks pass. |
hs_programs | List of absolute program paths to approve (uses apply_allowlist_seed() internally). |
hs_seeds | List of seed file paths, or literal inline paths when the entry is not an existing file. Seed files are plain text, one program path per line; # comments and blank lines are ignored. Combine freely with hs_programs. |
Additional variables include hs_gather_status (default true, exposes hs_status fact), hs_purge / hs_purge_allowlist (emit a warning only — the scriptable surface adds entries by design), and hs_python / hs_src_path overrides for non-standard install layouts.
Re-run behaviour: All allowlist operations return CommandResult with kind == "noop" when an entry is already present. The role uses this for correct changed_when reporting, so repeated plays do not show spurious changes.
Minimal example playbook:
# heartsuite-root-lock.yml
- name: Configure HeartSuite allowlist and engage Lockdown
  hosts: heartsuite_fleet
  become: true
  vars:
    hs_state: secure
    hs_programs:
      - /usr/sbin/sshd
      - /usr/bin/python3
    hs_seeds:
      - /var/lib/ansible/heartsuite/seed.txt
  roles:
    - heartsecurity.root_lock
After switching to secure or lockdown, a reboot is typically required for full seal; the role does not reboot automatically. Register facts (hs_status, hs_apply_result, hs_switch_result) are available for assertions or subsequent tasks.
Python API alternative: For custom Ansible modules or non-Ansible automation, the same functions are exposed via limited_tools: approve_program_path, apply_allowlist_seed, get_status, get_allowlist_programs, and switch_to_secure. These reuse the same gates and CommandResult semantics.
The heartsecurity.root_lock role is the preferred declarative path for post-install allowlist and mode work. Use the Python API (or thin custom tasks) when composing larger provisioning playbooks that also handle OS setup, hardening, or host-specific services.
See the reference provisioning starter in the code repository (ansible/examples/hs-debian12-provision/) for composition: it delegates SSH/SFTP hardening to the dev-sec collection, performs bundle-based installation, registers backup directories and alert configuration, starts with a minimal allowlist bootstrap, and shows how to harvest from real workload observation into a seed file before using the role for allowlist and mode.
Use these playbooks to carry out the change records your central system approves.
Shell + register alternative
Use Ansible to distribute seed files and invoke the batch or management tools with become: true:
# heartsuite-policy-apply.yml
- hosts: heartsuite_fleet
  become: true
  tasks:
    - name: Copy central program seed list
      copy:
        src: "policy/seeds/programs-{{ inventory_hostname }}.txt"
        dest: "/tmp/heartsuite-programs.txt"
        owner: root
        mode: '0600'

    - name: Apply baseline programs via batch tool
      shell: "/.hs/sys/batch_record_add.py /tmp/heartsuite-programs.txt"
      args:
        creates: "/.hs/sys/allowlist_applied_{{ inventory_hostname }}.stamp"

    - name: Apply targeted network and file deltas from central policy
      shell: |
        /.hs/sys/hs-app-perm-orders-manager add -x /usr/bin/curl -n 93.184.216.34
        /.hs/sys/hs-app-perm-orders-manager add -x /usr/bin/curl -d /etc/ssl/certs
      # Idempotency and error handling left to your playbook

    - name: Harvest the applied program list on the host
      shell: >
        /opt/heartsuite/venv/bin/python3 -c "import sys; sys.path.insert(0, '/opt/heartsuite/src');
        from core.limited_tools import get_allowlist_programs;
        print('\\n'.join(sorted(get_allowlist_programs() or [])))"
      register: hs_allowlist
      changed_when: false

    - name: Record application in central audit
      copy:
        content: "{{ hs_allowlist.stdout }}\n"
        dest: "policy/harvest/allowlist-{{ inventory_hostname }}.txt"
      delegate_to: localhost
      become: false
      # Then commit the harvest back to your policy repo
Without the role there is no CommandResult.kind == "noop" to drive changed_when, so add your own re-run checks (for example creates, or register + conditional tasks).
2. Splunk / Elastic (and similar SIEMs) — ingesting for central dashboards and policy triggers
The primary use of Splunk and Elastic is consumption of the structured data streams (see SIEM and Fleet Integration). Once events are in the SIEM:
- Build dashboards showing per-node mode, pending counts (from status.json), block rates, and approval activity (from the JSONL approval log forwarded via syslog or other shipper).
- Build views of the current allowlist and associated risks from the structured policy snapshots and posture data, including tables of programs with grant counts,
risk_level, and broad-write and network flags. Compare the allowlist you keep in Git for drift. Policy identity is not on status.json, syslog, webhook, or Kibana. - Use SOAR playbooks or alert actions in the SIEM to trigger Ansible Tower / AWX jobs or Terraform runs that apply approved policy updates back to affected hosts.
- Correlate HeartSuite enforcement events with change tickets to close the audit loop.
Syslog is the recommended high-volume path for both the per-decision enforcement stream and higher-level alerts. For richer views of the allowlist and posture (tables, metrics, and correlation) see SIEM and Fleet Integration.
Store allowlist seeds and change manifests in the same Git repository as your infrastructure code.
- Use Terraform
local_file or templatefile to render per-host or per-role seed files from a central policy definition. - During
terraform apply, a remote-exec provisioner, local-exec that calls Ansible, or a custom provider runs the seed application and hs-app-perm-orders-manager invocations on the new or updated instance. - Drift detection: scheduled jobs (or Terraform Cloud/Enterprise runs) harvest the program list with
get_allowlist_programs() from the limited_tools Python API, compare it with the allowlist you keep in Git, and open PRs or apply corrections. status.json is the health snapshot, not the policy identity. - Git history becomes the authoritative change record for policy; the on-host JSONL approval log provides the per-host attribution of when and by which uid/tty the change was executed.
This pattern works especially well for immutable or frequently reprovisioned fleets.
- Model allowlist additions, removals, or baseline updates as standard or emergency change requests.
- Approved changes update the Git (or equivalent) policy repository, then automation applies them per host.
- The automation (Ansible, scripts, or ServiceNow Flow Designer + MID server) applies the delta to the target hosts using the CLI tools above.
- On completion, the automation closes the change ticket and posts the resulting JSONL approval log excerpts (or a pointer to the SIEM record) as evidence.
This keeps policy changes inside the same approval workflow used for all other infrastructure changes.
5. Custom scripts and other configuration management (Puppet, Chef, Salt, etc.)
Any tool that can copy files and run commands as root on the target can drive policy:
- Puppet: a custom resource or exec that writes a seed list managed by Hiera or PuppetDB and then invokes
batch_record_add.py or hs-app-perm-orders-manager. - Chef: a recipe that templates policy from a data bag and executes the CLI tools.
- Pure scripts (Python, Bash, or your language of choice) run from a central runner or cron on a bastion: query the authoritative policy store, compute the diff for each host (or use a node-specific tag), SSH in, and apply.
The dedicated JSONL approval log (with uid/tty attribution for each change) and the enforcement/alert syslog streams give you the same audit trail regardless of which tool performed the apply.
Consuming data for central visibility, auditing, and harvesting
Status JSON and the JSONL approval log are written whenever the alert daemon is running. Syslog is off until you enable it on Alert Settings → Fleet. Webhook requires an HTTPS URL on that same tab.
Status JSON (~/.cache/heartsuite/status.json, updated every 60 seconds) — lightweight pull surface for health and pending counts. Use from Ansible facts, Nagios/Zabbix checks over SSH, or any scheduled collector. Key fields for fleet dashboards: mode, lockdown, is_hs_kernel, daemon_ok, pending_* counts, node_id. See the schema in the Appendices.
Dedicated JSONL approval log (/var/log/heartsuite/allowlist-audit.log) — persistent, append-only record of every allowlist approval (not skips or removals) with timestamp, uid, and tty. This is the primary artifact for change attribution. Forward that file with your existing log shipper. It is not copied into syslog.
Structured syslog streams — when Fleet Syslog is on, denial lines (HS-PROG-DENY, HS-FILE-DENY, and similar) and aggregated alerts (new_program_blocked, mode changes) share ident heartsuite. Alert lines use the message prefix heartsuite-alert:. A single rsyslog rule forwards both. Full configuration examples and Filebeat patterns are in the SIEM and Fleet Integration page.
Webhook — HTTPS POST of compact JSON alert payloads on every significant event. Configure the endpoint in Alert Settings; use for immediate routing into ServiceNow, PagerDuty, or your own policy-evaluation service.
Harvest current allowlist state — run get_allowlist_programs() from the limited_tools Python API, or /.hs/sys/hs-app-perm-orders-manager view -a for each program’s grants, on a schedule or on demand and commit the output to your central policy repository. This closes the loop: central sees what is actually enforced on each host and can detect drift or feed the next baseline.
See Alert Settings for configuration of syslog and webhook (Fleet tab) and SIEM and Fleet Integration for production-scale ingestion patterns.
Relationship to the Dashboard and Lockdown
The Dashboard remains the right surface for one-off investigation, initial setup on a new host, and guided maintenance windows. At fleet scale, routine policy application and observation move to your central tooling.
While Lockdown is on, alerts for programs waiting in the pending queues go to every configured channel.
Central automation drives allowlist policy and first install. It does not lift Lockdown.
- Similar hosts, first install: harvest once, package with install-time pre-seed, Ansible installs that package — the order above.
- Already in Lockdown: the official role does not unseal.
hs_state: setup leaves mode unchanged. Package installs and Root Lock bundle updates wait for Setup Mode — Protecting During Maintenance and Updating Root Lock. - Many locked hosts: reprovision from an updated image rather than a console session per node — Enterprise Adoption Guide.
For support with large-scale or custom automation patterns, contact support@heartsecsuite.com.